


Trends Support Natural Gas Demand
WASHINGTON—In its May Short-Term Energy Outlook, the U.S. Energy Information Administration sees oil prices falling but gas prices rising.
“Crude oil prices have been lower this year than we expected in our January 2025 STEO release, which largely reflects lower expectations for global oil demand growth both among market participants and in our forecast,” EIA observes. “Since the January release, we have reduced our expectations for global oil demand by a total of 0.5 million barrels per day throughout the forecast period, while we have lowered the Brent crude oil price forecast by $8/bbl on average.”
The agency expects crude oil prices to fall over much of the forecast period, which extends through 2026. The Brent crude oil spot price averaged $68 a barrel in April which is $5 less than March.
“In our forecast, increasing oil production outpaces annual oil demand growth, which rises by around 1.0 million bbl/d in both 2025 and 2026, leading to the accumulation of oil inventories globally,” EIA outlines. “We expect the rising inventories will result in the Brent price averaging $62/bbl in the second half of this year and falling to $59/bbl next year” (Figure 1).
FIGURE 1
Brent Crude Oil Spot Prices
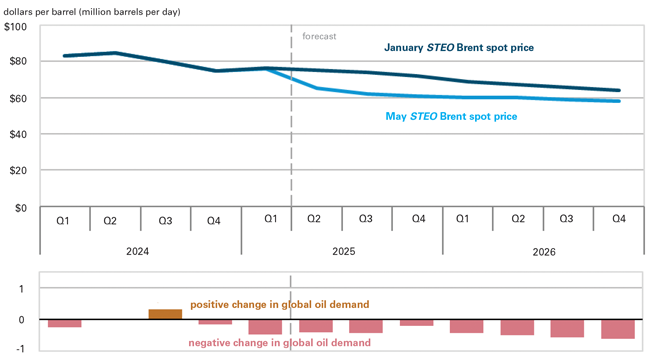
Source: U.S. Energy Information Administration’s May Short-Term Energy Outlook
Regarding production, EIA projects that global liquid fuels production will grow between 1.3 million and 1.4 million barrels a day in both 2025 and 2026. The agency notes that it completed this forecast before May 3, when OPEC+ announced plans to increase production in June. “Although we expect OPEC+ to increase production somewhat in the coming months, we expect OPEC+ production to remain below the current target path,” EIA comments.
Price Uncertainty
The price forecast faces significant uncertainty, EIA acknowledges. “The effect that new or additional tariffs will have on global economic activity and associated oil demand is still highly uncertain and could weigh heavily on oil prices going forward,” it illustrates. “The implementation of energy-sector sanctions on Russia and Iran as well as the wind down of Chevron’s Venezuela oil exports have increased uncertainty in the short term while markets and trade patterns adjust. In addition, the pace at which OPEC+ decides to unwind production cuts and the level of adherence to announced production targets continues to evolve.”
The EIA notes it is not the only organization facing uncertainty. “High levels of implied volatility—a measure of market participants’ expectations for the range of crude oil futures price changes—suggest considerable market uncertainty,” the Outlook reports. “Since early April, crude oil implied volatility has averaged more than 35%, based on futures and options contract data from the CME Group, with daily Brent crude oil implied volatility reaching as high as 39% on April 8.”
To provide context, EIA says implied volatility has usually stayed below 30% since the beginning of 2024. The exceptions coincided with periods when people feared supply disruptions from geopolitical events. For example, last October, concern that the conflict in the Middle East would widen caused implied vitality to rise.
“The recent increase in implied volatility has been mostly driven by concerns of an economic slowdown or recession, rather than any risk of supply disruption,” EIA assesses.
Economic Outlook
EIA revised its GDP forecast downward from April to May. “We now assume real GDP will grow by 1.5% in 2025, a 0.5 percentage point reduction from the April STEO, and 1.6% in 2026, a 0.4 percentage point reduction from last month,” it clarifies.
EIA’s U.S. macroeconomic model is based on one from S&P Global. The most recent version includes the tariffs announced on April 2 but not the 90-day pause applied to certain countries, EIA notes. “As a result, our macroeconomic forecast assumes significantly lower tariffs on China’s products than are currently in place and significantly higher tariffs on countries subject to the 90-day temporary suspension. These differences in tariff rates likely have offsetting effects on the macroeconomic forecast,” EIA writes.
The Outlook does reflect China’s decision to waive a retaliatory tariff of 125% on imports of ethane from the United States. According to EIA, “nearly half of U.S. ethane exports go to China, and all of China’s ethane imports come from the United States with practically no options for alternative sources.”
With China’s tariff on ethane gone, EIA sees strong production ahead. “We forecast the United States will produce 2.9 million bbl/d of ethane this year and 3.1 million bbl/d next year, up from 2.8 million bbl/d in 2024. Most of this growth in ethane production will be exported to supply growing international demand.”
The agency says U.S. ethane exports have grown in response to higher global petrochemical demand, ethane’s lower cost compared to other feedstocks, and an expanding fleet of tankers capable of shipping ethane.
Natural Gas
As LNG exports grow and the summer heat pushes electricity demand up, EIA predicts that natural gas prices will climb in the months ahead. “We forecast the Henry Hub spot price will average nearly $4.20/MMBtu in the third quarter of 2025,” the Outlook says. “Despite rising seasonal demand for natural gas heading into summer, our forecast for the 3Q25 Henry Hub price is almost double the price from a year earlier and is contributing to our expectation of less natural gas use in the electric power sector on average this year compared with last year.”
While it will remain the largest source of electricity generation in the United States, natural gas consumption related to power generation should fall 3% from 2024 to 2025, EIA says. “The main reason for less expected natural gas generation is rising prices for the fuel compared with last year’s historic lows,” it explains. “We forecast that the price of natural gas delivered to power generators will average $4.50 per MMBtu in 2025, up 63% from the average price in 2024.”
The price has fallen, in the short term, EIA notes. “On April 30, 2025, the natural gas spot price at Henry Hub settled at $3.12 per MMBtu, compared with $3.96/MMBtu on April 1, 2025. The average spot price in April was $3.44/MMBtu, down 68 cents/MMBtu from the March average,” EIA relates.
“Several factors contributed to the decrease in natural gas prices in March and April,” the agency continues. “Demand has remained steady, with more demand from increased U.S LNG exports offset by a warmer-than-normal start to spring, which brought lower levels of residential and commercial demand and stable demand in the electric power sector. Additionally, relatively high production of dry natural gas has contributed to lower prices.”
During March and April, 331 billion cubic feet of gas was put into storage, more than twice the five-year average of 135 Bcf. This strong injection has brought total gas in storage close to the five-year average.
However, “less natural gas than is typical will be put into storage over the rest of the injection season, which ends on October 31,” the EIA writes. “We forecast natural gas inventories will close the injection season 3% below the five-year average.”
Those lower storage volumes should translate into higher prices. The EIA projects that the Henry Hub spot price will average $4.10/MMBtu in 2025 and $4.80/MMBtu in 2026 (Figure 2).
FIGURE 2
U.S. Henry Hub Natural Gas Prices
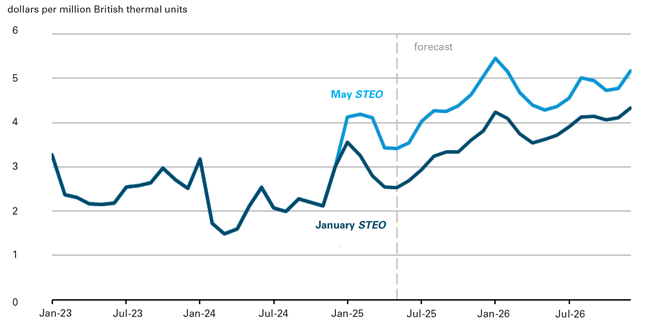
Source: U.S. Energy Information Administration’s May Short-Term Energy Outlook
The agency points out that these forecasts represent a $0.80–$1.00/MMBtu increase over its January STEO and attributes the change to three factors.
“January was colder than forecast, which led to a large draw from storage and contributed to our assumption that less natural gas will be held in storage during 2025 and 2026 than we had forecast going into this year,” the EIA begins. “Additionally, we now forecast that there will be more demand for natural gas domestically and for U.S. exports of natural gas over the next two years than we had initially forecast. Finally, a drop in crude oil prices over the past three months has reduced our expectations for U.S. crude oil production growth, and we now expect less associated natural gas production than we did in January.
“Together, these factors mean we expect natural gas prices will be higher in order to incentivize production and keep markets balanced,” the EIA states.
Growing Demand
The EIA calls natural gas exports the main driver of increasing natural gas demand in 2025 and 2026. “Two liquefied natural gas export facilities—Plaquemines LNG Phase 1 and Corpus Christi Stage 3—started production in December 2024. Two additional LNG developments—Golden Pass and Plaquemines LNG Phase 2—are expected to come online over the next two years,” the Outlook notes. “As a result, we forecast LNG exports to increase 22% in 2025 and 10% in 2026.”
Pipeline exports should increase 8% in 2025 and 7% in 2026, the EIA adds. “In total, we expect natural gas exports to increase by 3.4 Bcf/d in 2025 and 2.1 Bcf/d in 2026,” it reports.
The Natural Gas Supply Association’s Summer Outlook, which is prepared by Energy Ventures Analysis, also sees LNG exports as an important demand driver.
“U.S. LNG remains strongly supported by global pricing, with net backs to Europe and Asia holding at $6–$7/MMBtu and regional spreads maintaining a $3–$4/MMBtu premium over Henry Hub,” EVA observes. “These margins have helped drive feedgas demand to near-record levels of over 16 Bcf/d in early 2025.”
Trade policy is influencing LNG exports’ destination, EVA notes. “With China’s retaliatory tariffs (on LNG) still in place, Europe remains the dominant growth market, accounting for the largest share of U.S. LNG exports in early 2025,” it says. “Trade tensions continue to influence global flows, though total export volumes have remained resilient.”
Like LNG exports, industrial gas use should create structural increases in gas demand, EVA says. “Industrial gas demand has grown by 0.25 Bcf/d from new projects since 2023, with momentum expected to build further from 2026 onward,” the firm estimates. “Under the current Trump administration, pro-energy policies are likely to accelerate development—particularly across Gulf Coast manufacturing and petrochemical sectors.”
Figure 3 shows the announced industrial projects and their potential impact. “2027 is estimated to shape up as a turning point, marked by a sharp rise in both project count and demand,” EVA comments. “This trend signals renewed industrial investment cycles tied to infrastructure buildout and improved policy certainty.”
FIGURE 3
Industrial Projects and Gas Demand

Source: Energy Ventures Analysis
EVA says data centers should also contribute to demand. “Total U.S. data center demand should grow 60% between 2023 and 2026, reaching more than 30 gigawatts,” the firm projects.
Virginia should have more than 10 GW of capacity by 2026, EVA says, noting this is more than double any other state. EVA adds that Ohio, Illinois and Pennsylvania, which are also part of the PJM grid system, should also play a significant role, with each expected to have more than 3 GW of capacity by 2026.
Outside PJM, the second-biggest hot spot is the Electric Reliability Council of Texas, which EVA predicts will add 800 megawatts to 1.2 GW a year thanks to favorable policies, competitive energy prices and available land. “By 2026, Texas is expected to house more than 4 GW of cumulative data center capacity, making it a key player in future expansion,” EVA says.
“Nevada and Georgia are gaining attention with smaller but fast-growing pipelines, especially for co-location and edge-computing facilities,” the firm adds.
Short-Term Considerations
The Matterhorn and Mountain Valley pipelines starting up last year have made huge differences for natural gas supply, EVA assesses. “Supply takes a material step forward in summer 2025, with U.S. production rising by 5 Bcf/d over summer 2024 levels,” EVA calculates. “This growth is tied to associated gas from the Permian and higher Marcellus production.”
The firm projects that U.S. lower 48 natural gas inventories will remain near the five-year average through summer. While modest injections will occur, EVA calls further supply growth unlikely unless the market tightens.
“Henry Hub prices post-winter have fallen, offering little incentive for most producers to ramp up drilling,” EVA explains. “With storage near typical levels and demand growth still modest, there is limited pressure to add new supply.”
If something unexpected happens and short-term signals justify increasing supply, producers may need to drill rather than relying on DUCs. “DUC inventories across major basins have declined over 40% since early 2021, with Appalachia, Eagle Ford and Haynesville all showing sustained drawdowns,” EVA reports. “This structural reduction suggests the industry has largely worked through its backlog of uncompleted wells—limiting the buffer producers once relied on to quickly ramp output without new drilling.”
Power Generation
This summer, power burn should be 9.7 Bcf/d above 2015 levels, EVA predicts. According to the firm, 7.5 Bcf of that increase comes from structural growth, while 2.2 Bcf/d reflects economic switching.
EVA predicts natural gas power demand will be lower this year than last year, but only by 0.1 Bcf/d. “The 0.8 Bcf/d drop in structural demand is nearly offset by a 0.7 Bcf/d rise in economic switching, highlighting natural gas’s continued dispatch flexibility,” EVA comments.
“While (natural gas power plant) additions slowed in 2024, a rebound is expected in 2025 as delayed projects move forward and market signals support new builds,” EVA says. “Since 2018, over 47 GW of gas and 32 GW of battery storage have been added, while coal retirements topped 74 GW, including 17 GW in the past two years. As more coal exits and summer demand rises, gas is positioned to capture greater dispatch share, supported by its flexibility and the growing role of storage in stabilizing peak loads.”
For other great articles about exploration, drilling, completions and production, subscribe to The American Oil & Gas Reporter and bookmark www.aogr.com.